VisualComplexity: The Ultimate Online Resource for Data Visualization
Explore the intricate world...
Tags:Analytical Drawing 绘图参考case studies Data Analysis Design Tools global resource industry trends information graphics visual representation VisualComplexity 数据可视化文章目录[隐藏]
Introduction to VisualComplexity
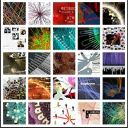
VisualComplexity is an online repository dedicated to the visualization of complex data and information graphics. It serves as a platform for showcasing a plethora of case studies and projects that illustrate the power of visual means in understanding and interpreting intricate datasets. The website is tailored for a global audience, including data analysts, designers, researchers, and anyone interested in the intersection of data and design.
Website Access
VisualComplexity can be accessed directly via the URL: http://www.visualcomplexity.com/, offering an easy entry point for users seeking to explore the world of data visualization.
Website Language
The primary language of the website is English, which is widely recognized and understood in the international community, making it accessible to a broad spectrum of users. While the website predominantly uses English, its global appeal suggests that the content is relevant and useful to speakers of various languages.
Features of VisualComplexity
VisualComplexity is characterized by its comprehensive collection of:
- Case Studies: Presenting a diverse array of data visualization projects that span across social, economic, and scientific domains.
- Tools and Resources: Offering links to data visualization tools, software, tutorials, and other resources that empower users to create their own visual representations.
- News and Trends: Sharing the latest news, trends, and research findings in the field of data visualization.
Industries and Fields
The website encompasses a wide range of industries and fields, making it a valuable resource for professionals and enthusiasts in areas such as urban planning, neuroscience, social collaboration, information categorization, natural order, and network thinking.
Usage Scenarios
VisualComplexity provides a variety of services and functionalities, including but not limited to:
- Inspiration for designers and analysts looking to visualize complex data.
- Educational resources for students and professionals seeking to understand data visualization techniques.
- A platform for researchers to share and discuss the latest advancements in visualizing information.
Related Links
For further exploration and resources, consider the following links: